

state.highstate (and related state function) results — no live Salt connection is needed to view the dashboard.
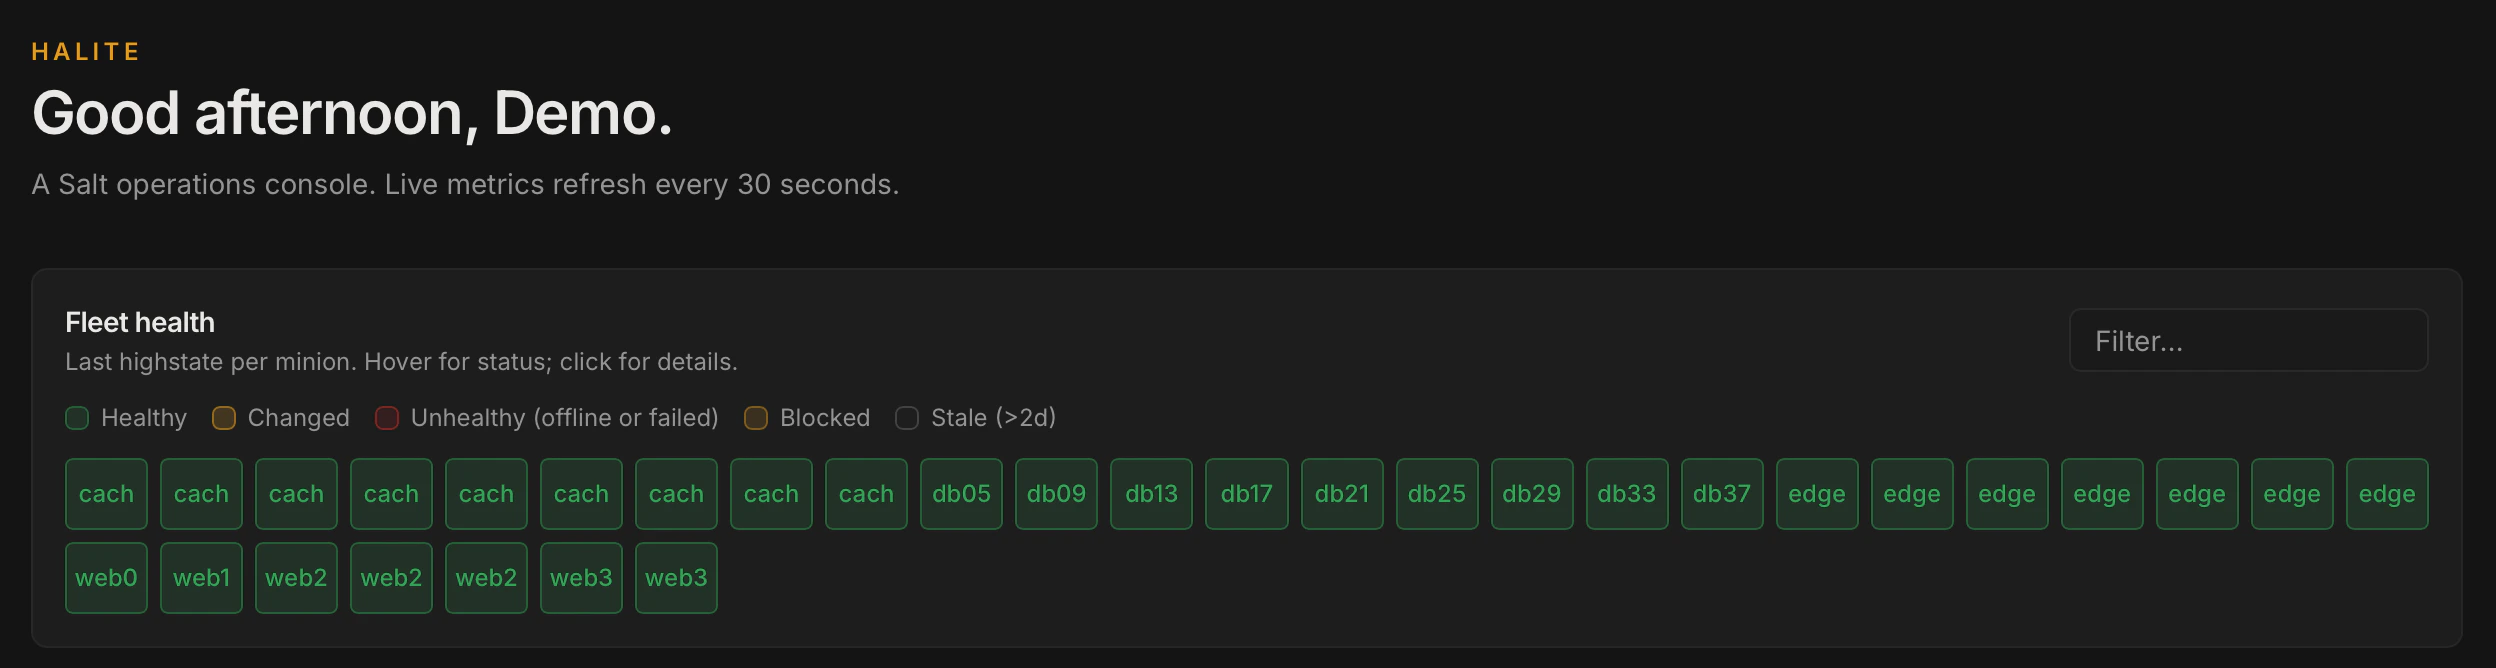
Fleet health heatmap showing per-minion health status badges
Health statuses
Each minion has exactly one health status, derived from its most recent ingested run and its current online/offline state. The status values (fromHealthStatus in fleet/schemas.py) are:
Offline minions (not in the
manage.present set) are always unhealthy, regardless of their last run’s result. A minion that has never had any run ingested but is currently online is unknown.API endpoints
GET /api/fleet/health
Returns the full fleet health snapshot as a FleetHealthOut list. Requires an authenticated session.
Each row in minions contains:
Connected-minion presence comes from the fleet scheduler’s cached
manage.present result. On cold start (before the scheduler has ticked), the endpoint falls back to the set of minions with at least one ingested run.
GET /api/fleet/compliance
Returns a compliance time series (oldest-first) for charting. Use the limit parameter to control how many recent runs are included (1–200, default 30). Each bucket corresponds to one highstate JID aggregated across all minions:
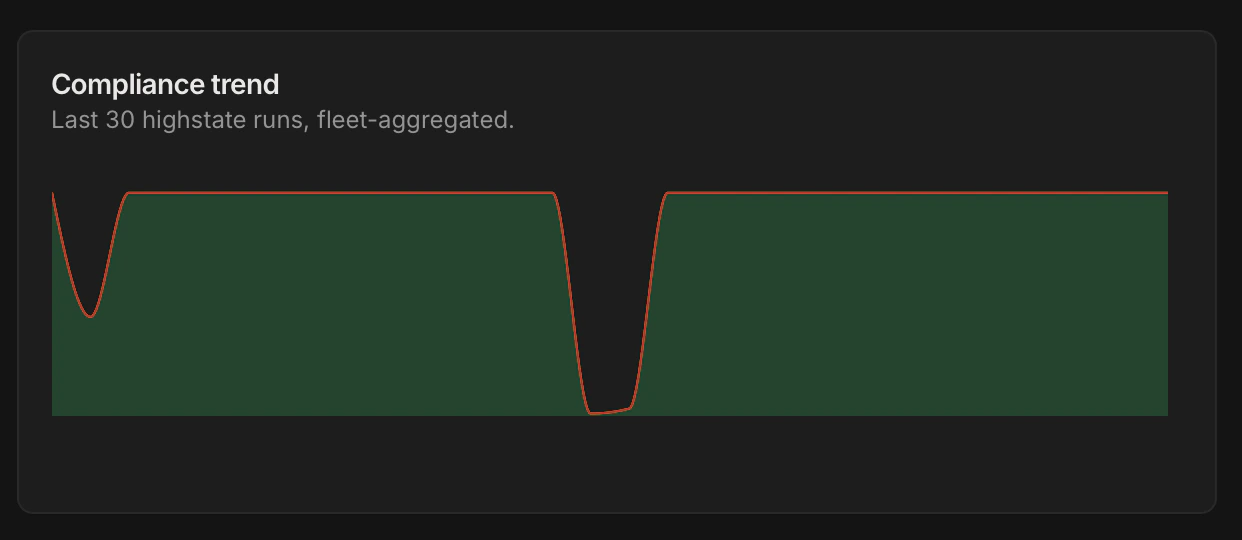
Compliance chart showing pass/fail/change trend over the last 30 highstate runs
GET /api/fleet/top-failures
Returns the states that have failed most often across the most recent run per minion. Use limit to control how many entries are returned (1–50, default 10). Each entry contains:
GET /api/fleet/runs/{run_id}
Returns the full detail for a single ingested highstate run by its database UUID. The response includes the raw state.highstate return dictionary alongside the summarised counts.
How highstate runs are ingested
The fleet scheduler polls for recentstate.* jobs by reading the jobs_index table for JIDs whose started_at is within the configured lookback window. For each new JID found it calls runner.jobs.list_job on the Salt master and stores per-minion results.
The parser (fleet/parser.py) validates each minion’s return against the Salt lowstate key pattern (module_|-state_id_|-name_|-fun). Runs where the minion returned a “did not return” string sentinel are stored with blocked = True and zero counts. Runs that cannot be parsed as a valid lowstate dict are silently skipped.
Ingestion is idempotent on (minion_id, jid) — re-processing the same JID does not create duplicate rows.
Example: investigating a failing state
1
Open Fleet Health
Click Fleet in the left sidebar. Minions with a red
unhealthy badge have at least one failing state in their last highstate.2
Check Top Failures
The Top Failures panel shows which state IDs are failing on the most minions. If
file_|-/etc/myapp/config_|-/etc/myapp/config_|-managed appears at the top, the managed config file is the likely culprit.3
Drill into a minion
Click an unhealthy minion to open its detail panel. The most recent run is shown with per-state results — failing states are highlighted with the error comment from Salt.
Permissions
All fleet endpoints require an authenticated session only — there is no additionalrequire_perm call on any fleet route. Any logged-in Halite user can view fleet health data.