> ## Documentation Index
> Fetch the complete documentation index at: https://www.halite-app.com/llms.txt
> Use this file to discover all available pages before exploring further.
# Timeline
> A visual, at-a-glance grid of recent job activity over a time window.
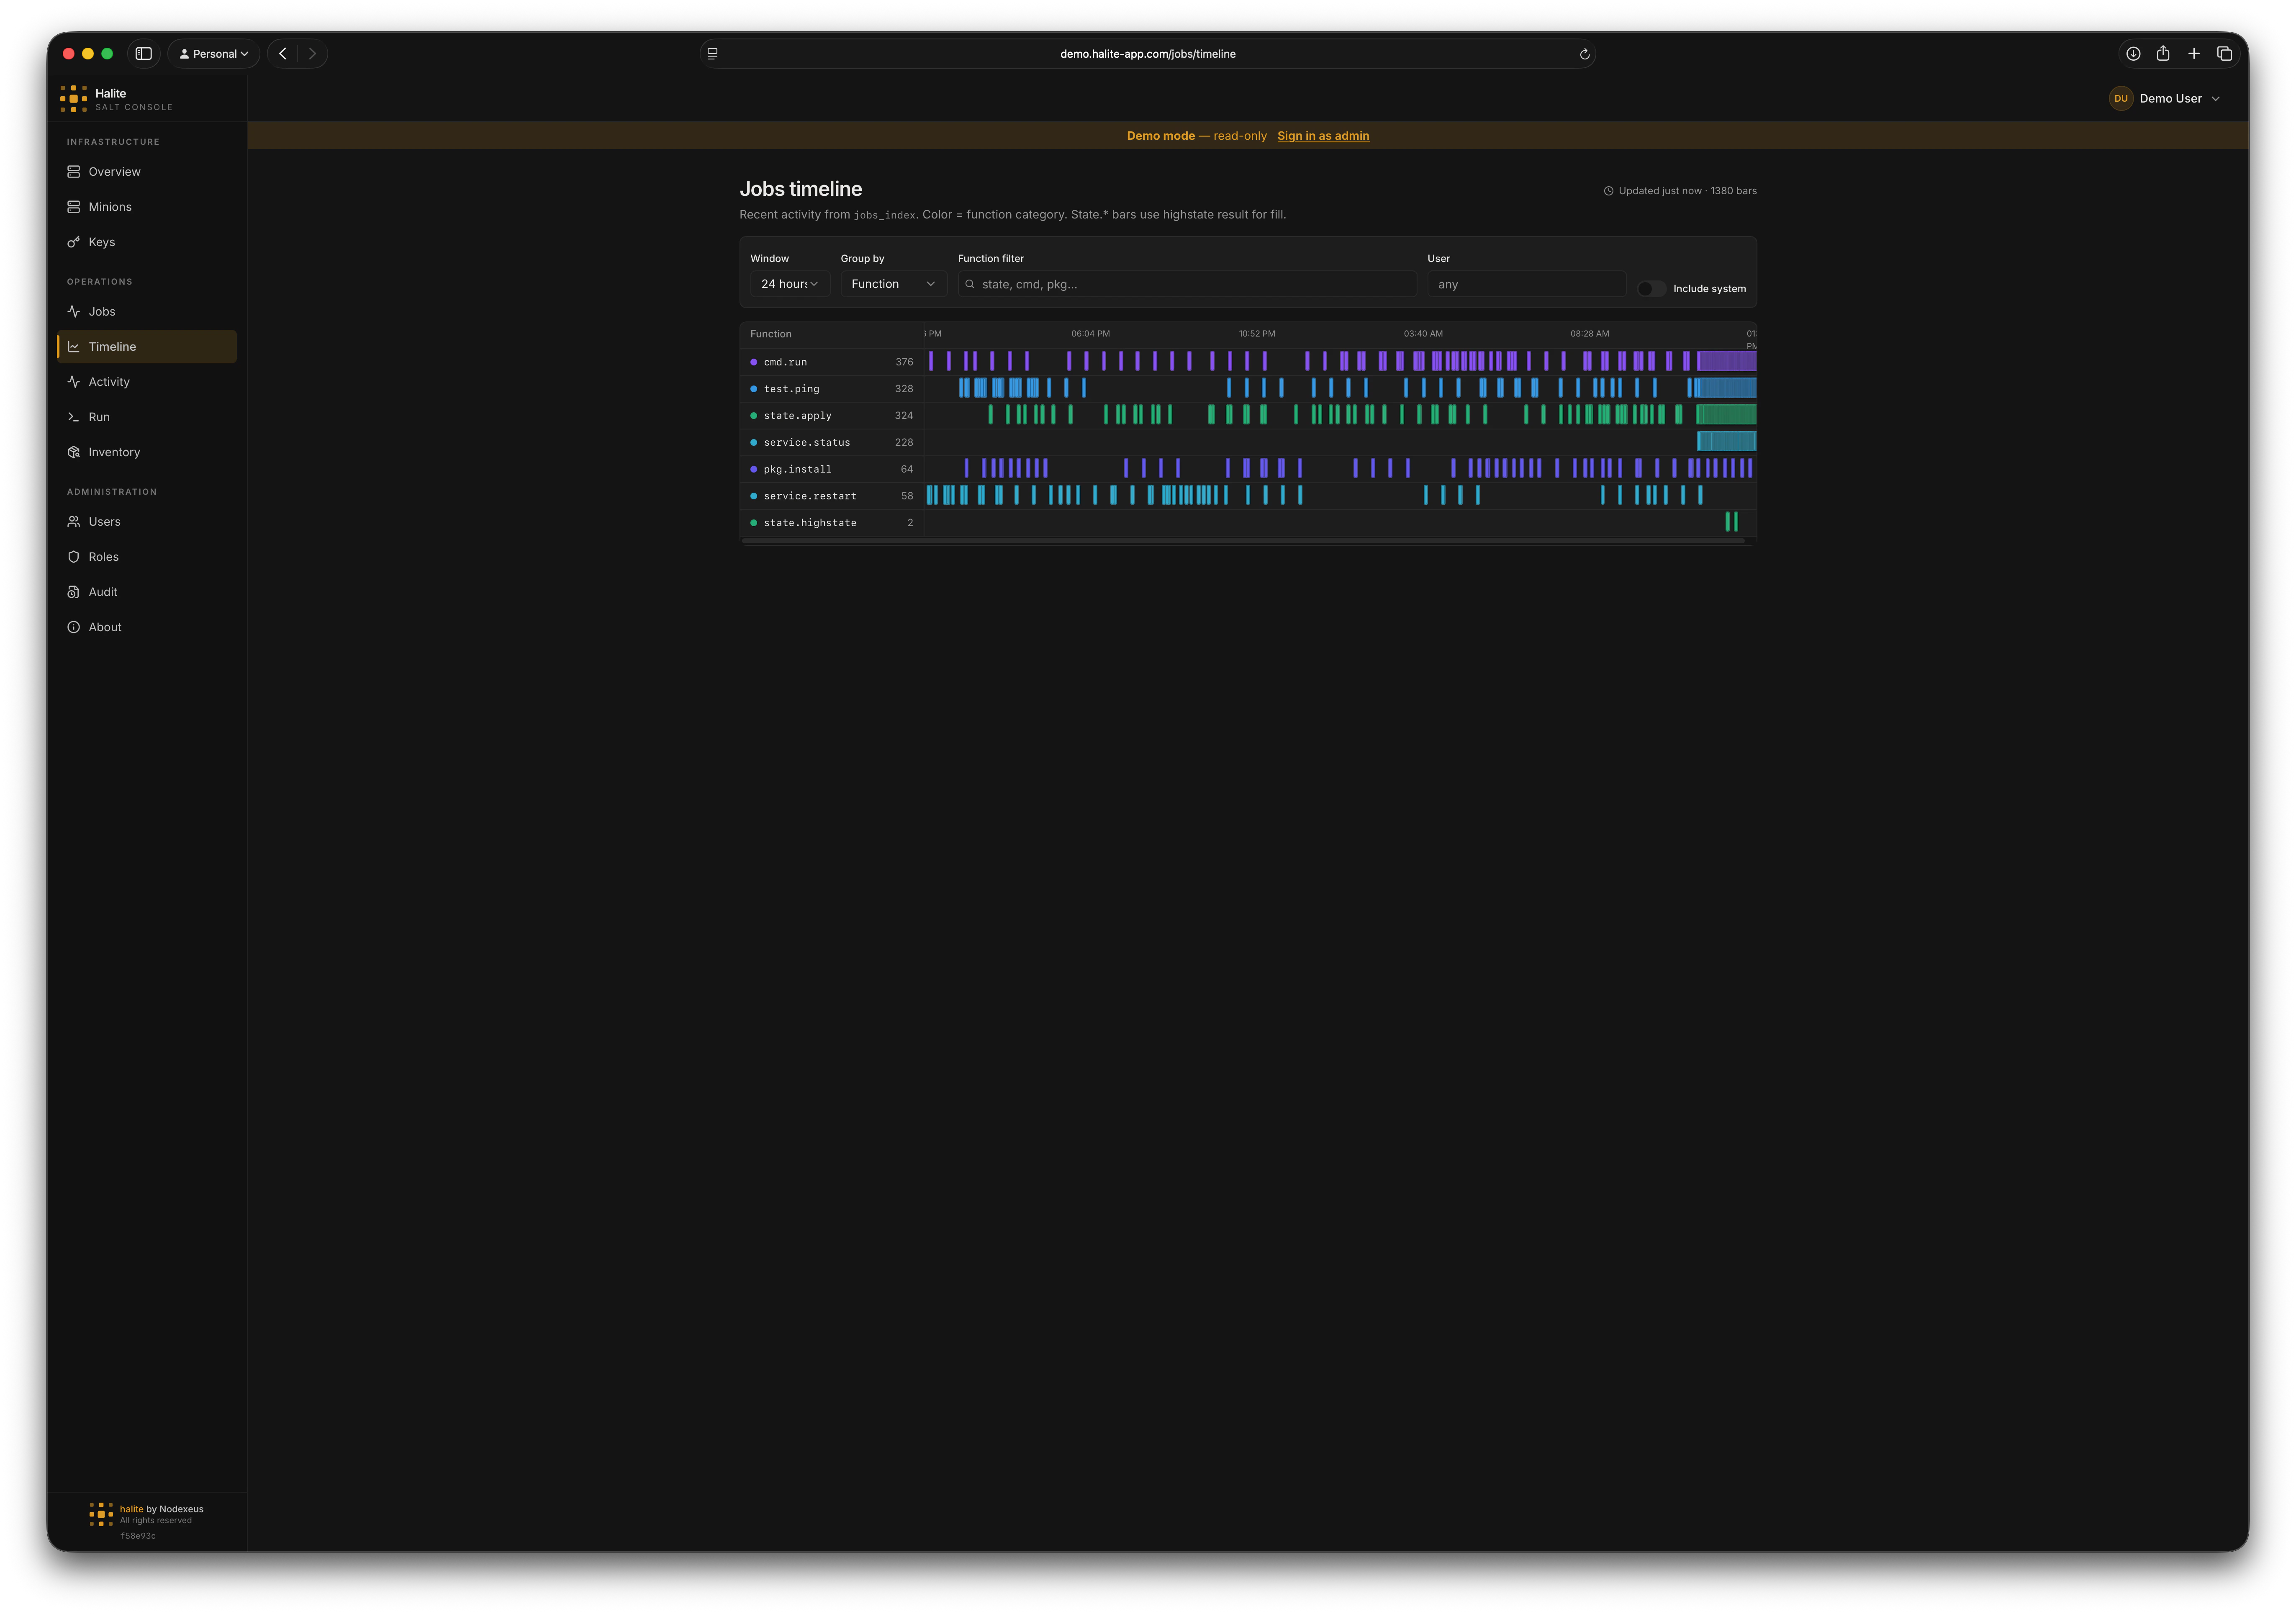
The Timeline gives you a bird's-eye view of everything your Salt deployment has been doing. Instead of reading jobs row by row on the [Jobs](/features/jobs) page, you see every job invocation plotted as a bar against time — grouped into rows, colored by function category, and (for state runs) filled by their highstate result.
Like the rest of Halite's read paths, the Timeline is served from the local database — it aggregates the `jobs_index` table together with ingested `highstate_runs` rather than calling the Salt master live. Running jobs are derived from the same in-memory active-JID cache the [Jobs](/features/jobs) page uses.
 ## Prerequisites
The Timeline reflects whatever the **jobs-index poller** has ingested. If the poller is not running, the page shows *"Jobs scheduler not running — enable in Settings → Pollers"* and stays empty. Enable it on the [Settings](/features/settings) page before relying on the Timeline.
## Reading the timeline
The grid plots time on the horizontal axis across the selected window. Each **row** is a group, and each **bar** is a single job invocation:
* **Rows** group jobs by function name (the default) or by the user who dispatched them. Busiest groups sort to the top.
* **Bars** are positioned by start time. `state.*` jobs — whose completion Halite derives from `highstate_runs` — render as a bar with width; other jobs, where no exact end time is known, render as a short start marker.
* **Row color** comes from the function category, so `state.*`, `cmd.*`, `pkg.*`, and the rest are visually distinct at a glance.
### Bar status
For `state.*` jobs the bar's fill encodes the highstate outcome; other jobs are treated as complete once they leave the active-JID cache.
| Status | Meaning |
| --------- | ---------------------------------------------------------------------------------- |
| `pass` | State run succeeded with no changes, or a non-state job completed |
| `changed` | State run applied changes |
| `failed` | State run had one or more failures (red intensity scales with failed-minion count) |
| `running` | The JID is still in the active-JID cache |
| `unknown` | A state job whose result hasn't been ingested yet |
### Function categories
The row label color is derived from the function prefix:
`state` · `cmd` · `pkg` · `service` · `test` · `runner` · `wheel` · `manage` · `other`
Functions that don't match a known prefix fall into `other`.
## Filters
A filter bar at the top of the page controls what's plotted:
* **Window** — the time range to plot: `1 hour`, `4 hours`, `24 hours` (default), or `7 days`.
* **Group by** — `Function` (default) or `User`.
* **Function filter** — a case-insensitive substring match against the function name (e.g. `state`, `cmd`, `pkg`).
* **User** — restrict to jobs dispatched by a single Salt user.
* **Include system** — off by default. When off, Halite hides its own background traffic (`runner.*`, `wheel.*`, and `manage.*`) so the view shows operator-driven activity. Turn it on to see everything.
The Timeline caps the plot at the 2,000 most-recent jobs in the window to keep rendering smooth. A freshness indicator in the page header shows when the data was last polled and how many bars are displayed.
## Inspecting a bar
Hover any bar to open a detail popover with the job's `jid`, `function`, `target`, `user`, start time, and status. For `state.*` jobs it also shows the responding minion count and, when present, the failed-minion count.
To drill into full per-minion results, open the [Jobs](/features/jobs) page and look up the same JID.
## Permissions
| Action | Permission |
| -------------------------------------------- | ------------ |
| View the timeline (`GET /api/jobs/timeline`) | `view:job:*` |
The built-in **operator** and **viewer** roles both have `view:job:*`, so both can use the Timeline. Every access is recorded in the [audit log](/concepts/audit-log).
## Prerequisites
The Timeline reflects whatever the **jobs-index poller** has ingested. If the poller is not running, the page shows *"Jobs scheduler not running — enable in Settings → Pollers"* and stays empty. Enable it on the [Settings](/features/settings) page before relying on the Timeline.
## Reading the timeline
The grid plots time on the horizontal axis across the selected window. Each **row** is a group, and each **bar** is a single job invocation:
* **Rows** group jobs by function name (the default) or by the user who dispatched them. Busiest groups sort to the top.
* **Bars** are positioned by start time. `state.*` jobs — whose completion Halite derives from `highstate_runs` — render as a bar with width; other jobs, where no exact end time is known, render as a short start marker.
* **Row color** comes from the function category, so `state.*`, `cmd.*`, `pkg.*`, and the rest are visually distinct at a glance.
### Bar status
For `state.*` jobs the bar's fill encodes the highstate outcome; other jobs are treated as complete once they leave the active-JID cache.
| Status | Meaning |
| --------- | ---------------------------------------------------------------------------------- |
| `pass` | State run succeeded with no changes, or a non-state job completed |
| `changed` | State run applied changes |
| `failed` | State run had one or more failures (red intensity scales with failed-minion count) |
| `running` | The JID is still in the active-JID cache |
| `unknown` | A state job whose result hasn't been ingested yet |
### Function categories
The row label color is derived from the function prefix:
`state` · `cmd` · `pkg` · `service` · `test` · `runner` · `wheel` · `manage` · `other`
Functions that don't match a known prefix fall into `other`.
## Filters
A filter bar at the top of the page controls what's plotted:
* **Window** — the time range to plot: `1 hour`, `4 hours`, `24 hours` (default), or `7 days`.
* **Group by** — `Function` (default) or `User`.
* **Function filter** — a case-insensitive substring match against the function name (e.g. `state`, `cmd`, `pkg`).
* **User** — restrict to jobs dispatched by a single Salt user.
* **Include system** — off by default. When off, Halite hides its own background traffic (`runner.*`, `wheel.*`, and `manage.*`) so the view shows operator-driven activity. Turn it on to see everything.
The Timeline caps the plot at the 2,000 most-recent jobs in the window to keep rendering smooth. A freshness indicator in the page header shows when the data was last polled and how many bars are displayed.
## Inspecting a bar
Hover any bar to open a detail popover with the job's `jid`, `function`, `target`, `user`, start time, and status. For `state.*` jobs it also shows the responding minion count and, when present, the failed-minion count.
To drill into full per-minion results, open the [Jobs](/features/jobs) page and look up the same JID.
## Permissions
| Action | Permission |
| -------------------------------------------- | ------------ |
| View the timeline (`GET /api/jobs/timeline`) | `view:job:*` |
The built-in **operator** and **viewer** roles both have `view:job:*`, so both can use the Timeline. Every access is recorded in the [audit log](/concepts/audit-log).