> ## Documentation Index
> Fetch the complete documentation index at: https://www.halite-app.com/llms.txt
> Use this file to discover all available pages before exploring further.
# Overview
> Dashboard KPIs and fleet activity charts.
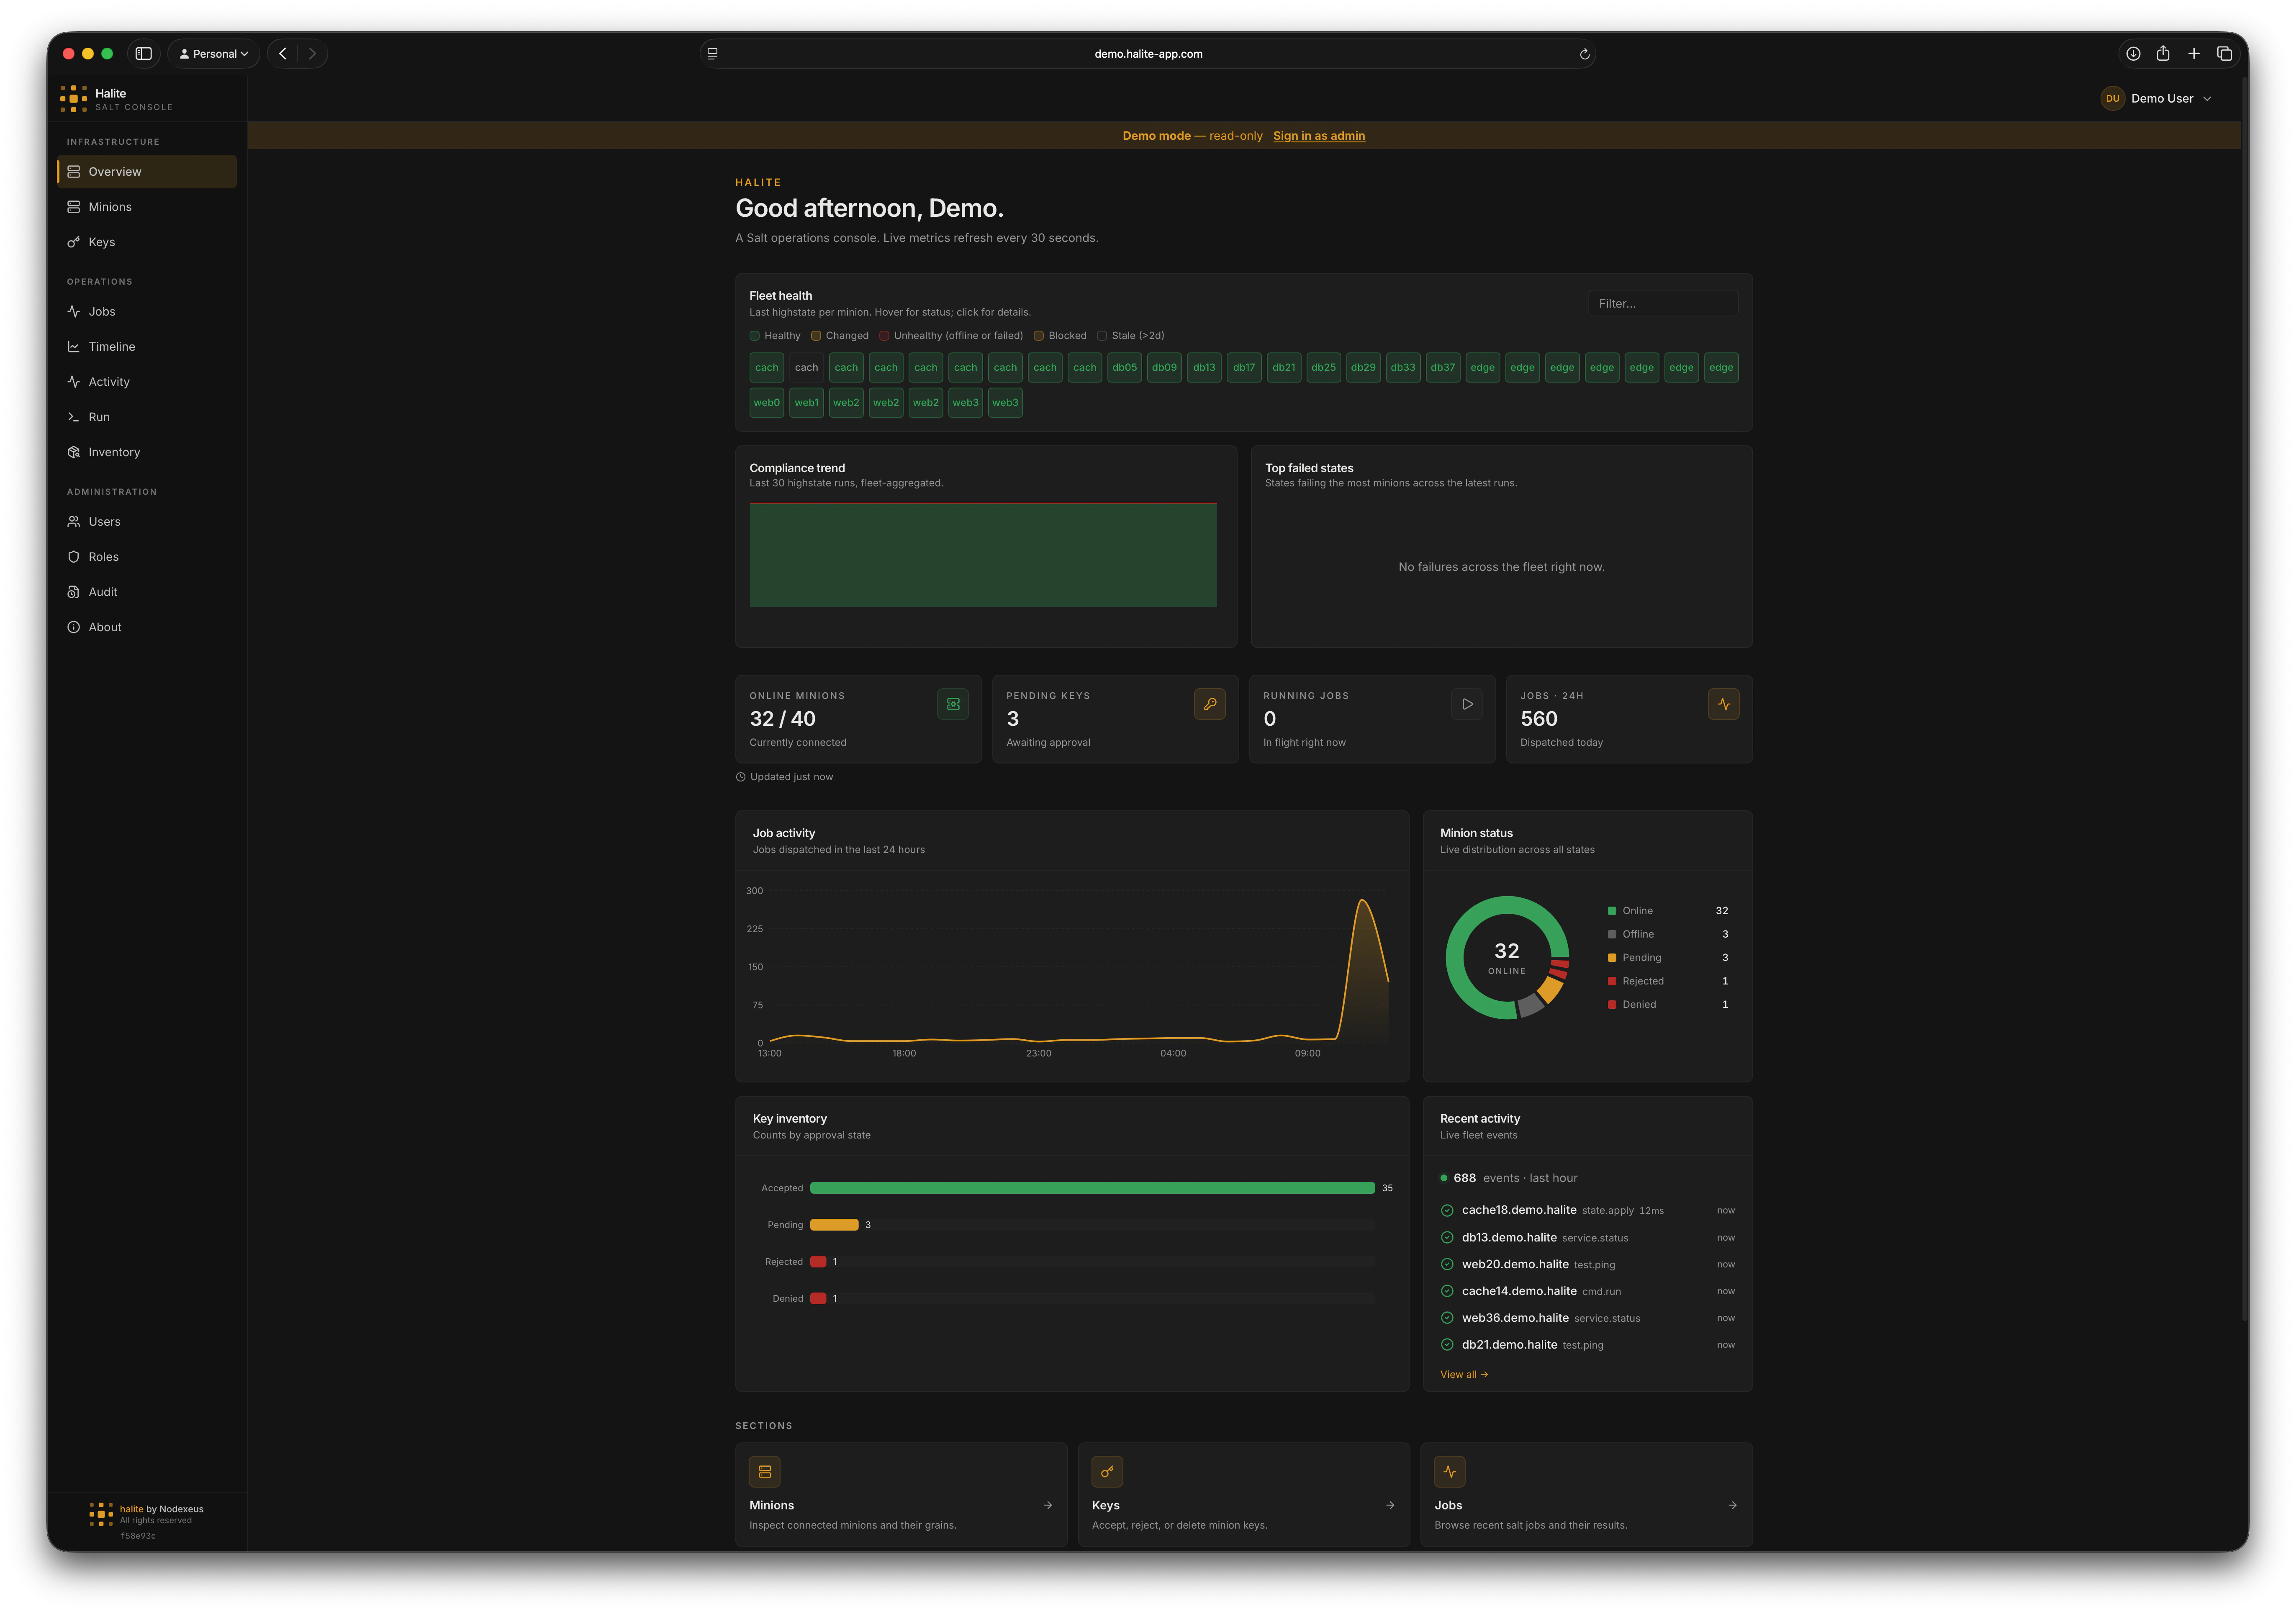
The Overview page is the first screen you see after signing in. It gives you an at-a-glance health summary of your entire fleet — four live KPI tiles, three activity charts, a fleet heatmap, and quick-jump tiles to every other section of the console.
All metrics refresh automatically every 30 seconds without a page reload.
 ## KPI tiles
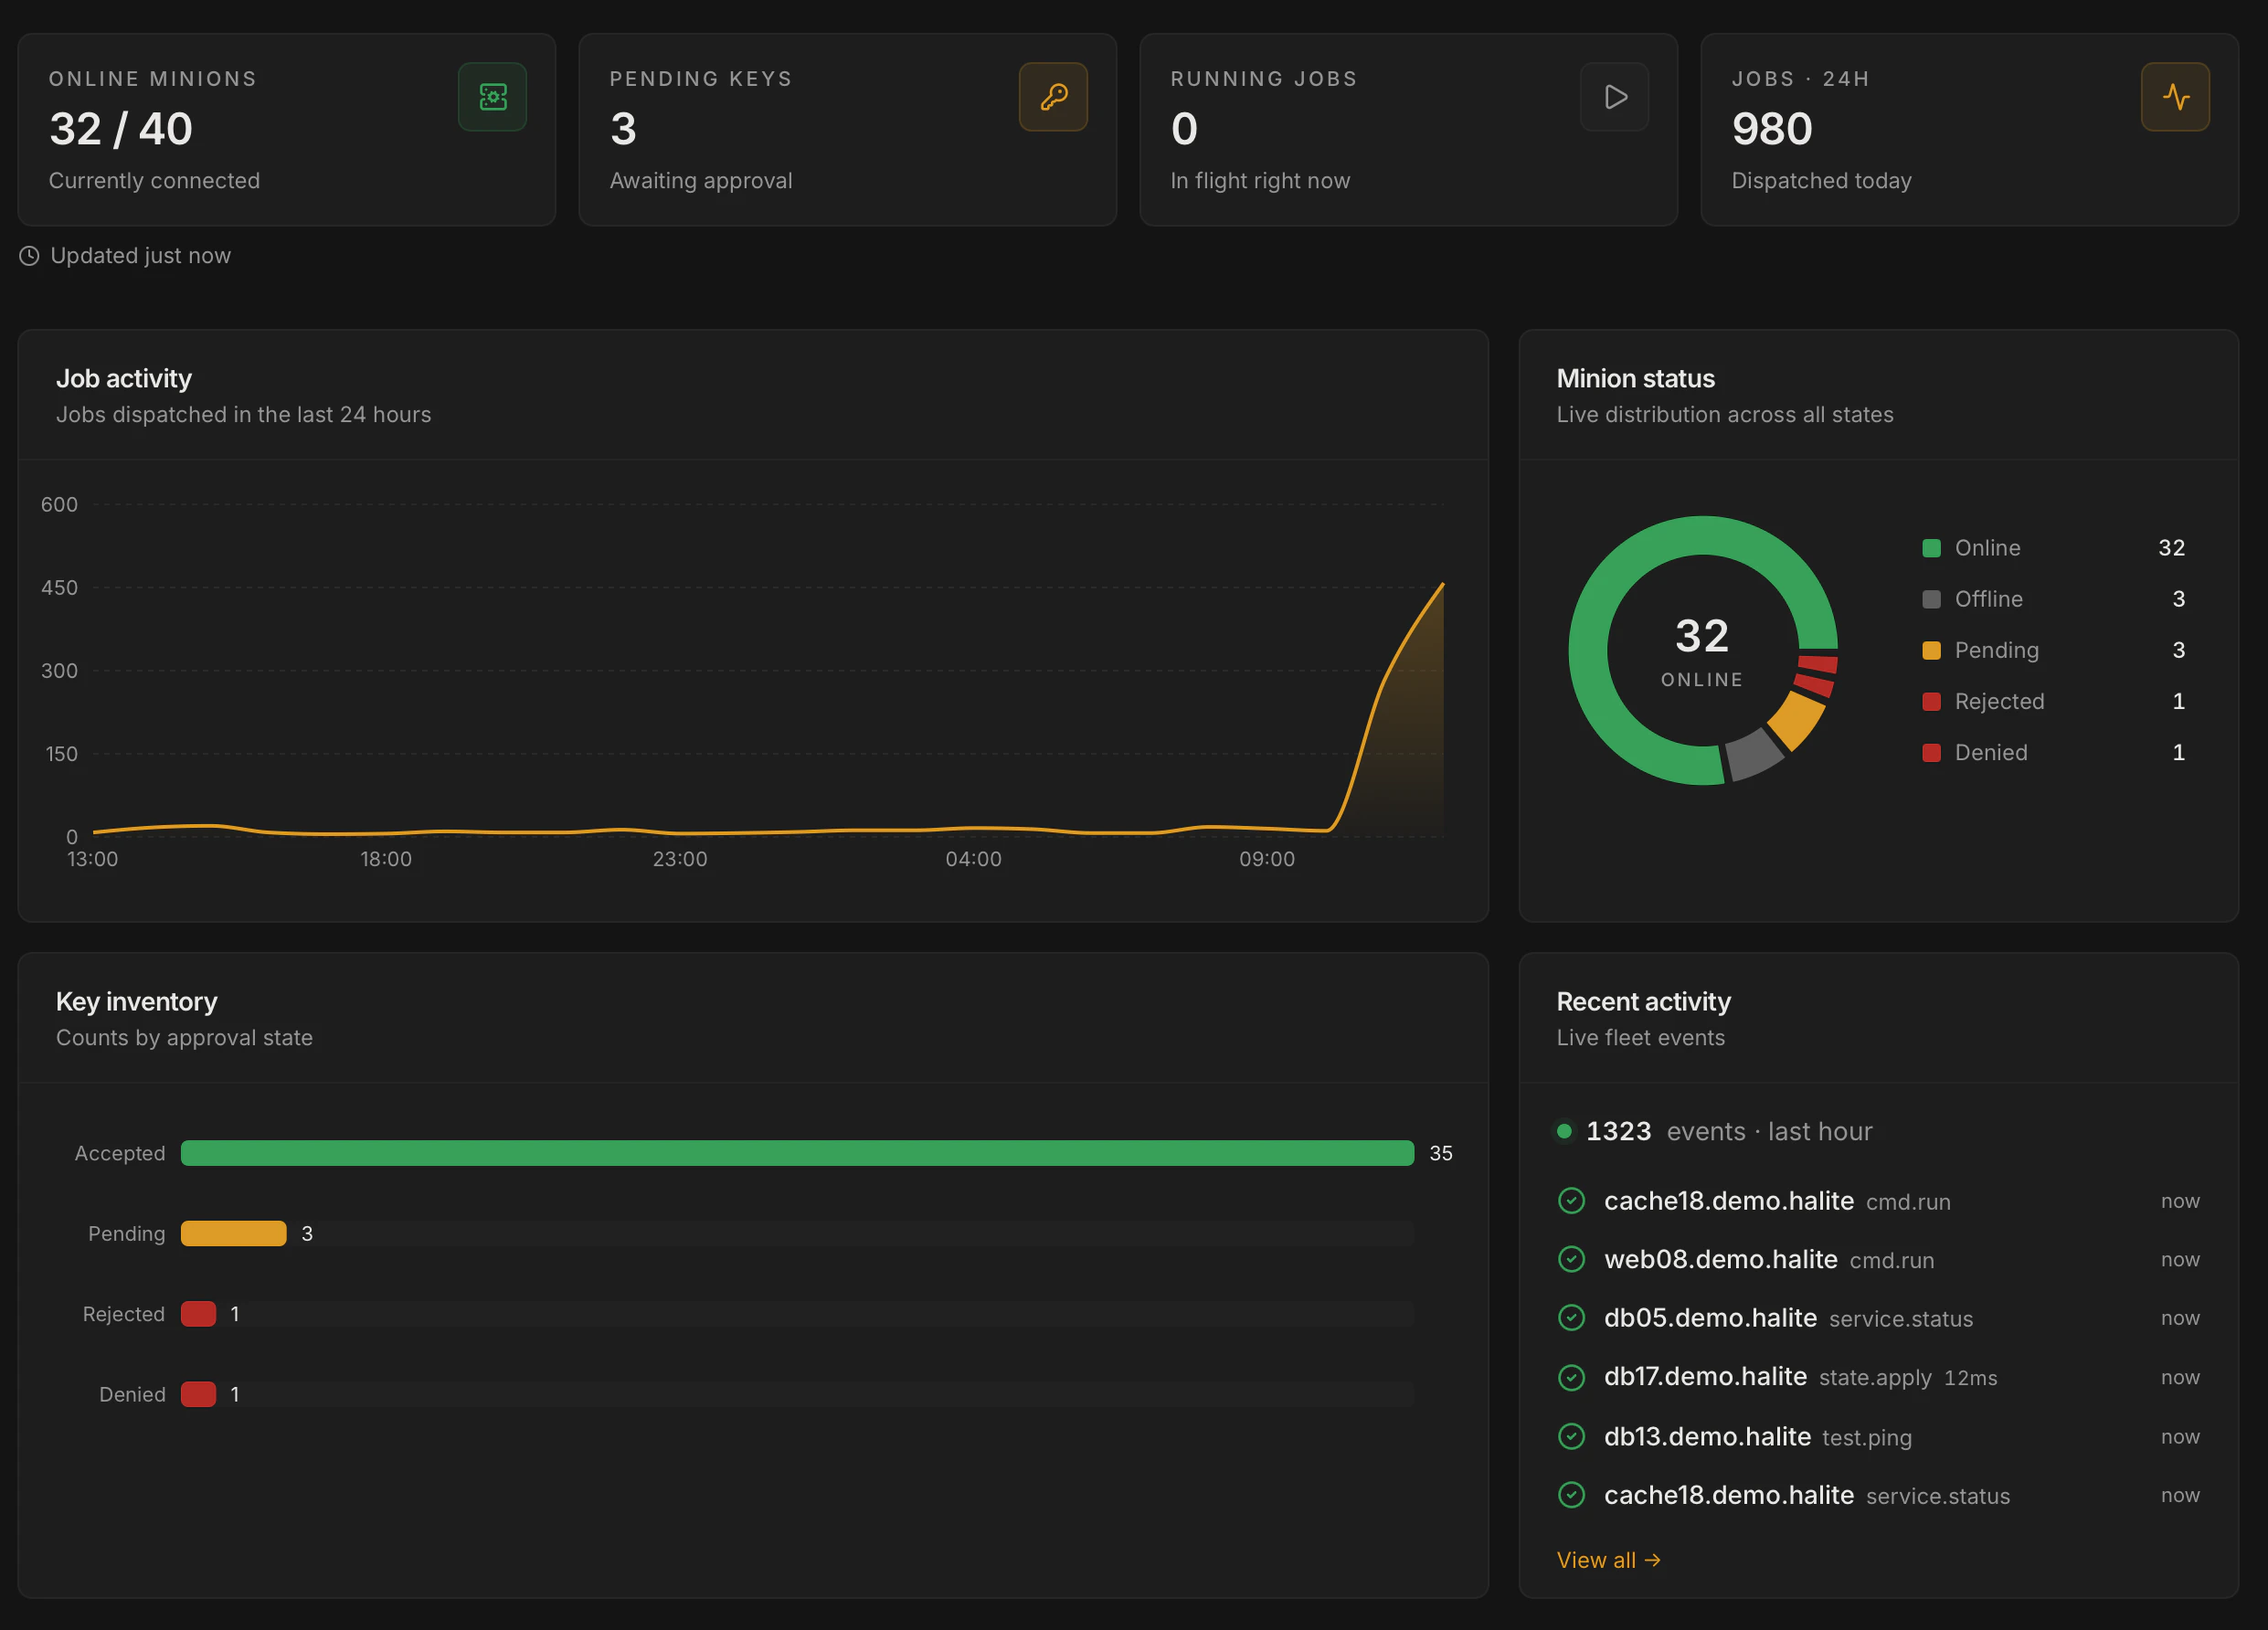
The four stat cards at the top of the page answer the most common operational questions at a glance:
| Tile | Source | What it measures |
| ------------------ | -------------------- | ---------------------------------------------------------------------- |
| **Online minions** | `/api/minions` | Minions whose `status` is `online` out of the total known |
| **Pending keys** | `/api/keys` | Keys whose `status` is `pending` (awaiting acceptance) |
| **Running jobs** | `/api/jobs/activity` | Jobs currently in-flight according to the scheduler's active-JID cache |
| **Jobs · 24h** | `/api/jobs/activity` | Total jobs dispatched in the last 24 hours |
## KPI tiles
The four stat cards at the top of the page answer the most common operational questions at a glance:
| Tile | Source | What it measures |
| ------------------ | -------------------- | ---------------------------------------------------------------------- |
| **Online minions** | `/api/minions` | Minions whose `status` is `online` out of the total known |
| **Pending keys** | `/api/keys` | Keys whose `status` is `pending` (awaiting acceptance) |
| **Running jobs** | `/api/jobs/activity` | Jobs currently in-flight according to the scheduler's active-JID cache |
| **Jobs · 24h** | `/api/jobs/activity` | Total jobs dispatched in the last 24 hours |
 The KPI tiles render a dash (`—`) for any metric your role does not have permission to view. The tiles are independent — having `view:job:*` but not `view:key:*` is valid.
## Activity charts
Below the KPI row, three charts give you a time-series and distribution picture of fleet activity:
### Job activity area chart
A 24-hour area chart of jobs dispatched per hour, built from the `jobs_index` database table. The server buckets the data by hour before sending it to the browser, so the chart scales past whatever the in-memory job-cache can hold. The `active_known` flag lets the UI warn you when the background scheduler has not yet ticked.
### Minion-status donut
A donut chart breaking down all known minions by their status: **online**, **offline**, **pending**, **rejected**, or **denied**. Data comes from the same minion snapshot table used by the [Minions](./minions) page.
### Key-status bar chart
A bar chart grouping all keys by their approval state (accepted, pending, rejected, denied). This gives you an inventory-level view of fleet onboarding health. The data is served live from the Salt master via the same `/api/keys` endpoint used by the [Keys](./keys) page.
## Recent activity
When the [event stream](/features/settings#event-stream) is enabled, the Overview includes a **Recent activity** widget — a compact, live-updating list of the latest fleet events (jobs, keys, minions) that links through to the full [Activity](/features/activity) page.
At the top of the widget, a **heartbeat** indicator with a pulsing dot shows how many events arrived in a recent window (for example, *"12 events · last 60 min"*). It is a quick pulse-check that the fleet — and the event stream — is alive.
An admin tunes the widget from [Settings → Activity widget](/features/settings#activity-widget): which categories it shows, whether to hide dispatches or routine successes, how many events to list, and the heartbeat window. Those display settings are read by every user via `GET /api/activity/widget-config`; the underlying events are still filtered to the categories your role can view.
## Fleet heatmap and compliance sparkline
Above the KPI row, the **fleet heatmap** shows every minion as a tile, colour-coded by online/offline status; clicking a tile opens a side panel where you can run a command directly against that minion. Below it, the **compliance sparkline** and **top-failures chart** surface recent highstate trends.
## Navigation tiles
At the bottom of the page, a grid of section tiles links to every major feature. Tiles your role cannot access are hidden automatically — you only see what you have permission to use.
## Permissions
The Overview page assembles data from multiple endpoints. Each section is gated by the permission of its underlying endpoint:
| Section | Permission required |
| ------------------------- | ------------------- |
| Minion KPI / donut | `view:minion:*` |
| Keys KPI / bar chart | `view:key:*` |
| Running jobs / area chart | `view:job:*` |
Any authenticated session can load the page shell; the tiles and charts that you lack permissions for render a graceful empty state rather than an error.
The KPI tiles render a dash (`—`) for any metric your role does not have permission to view. The tiles are independent — having `view:job:*` but not `view:key:*` is valid.
## Activity charts
Below the KPI row, three charts give you a time-series and distribution picture of fleet activity:
### Job activity area chart
A 24-hour area chart of jobs dispatched per hour, built from the `jobs_index` database table. The server buckets the data by hour before sending it to the browser, so the chart scales past whatever the in-memory job-cache can hold. The `active_known` flag lets the UI warn you when the background scheduler has not yet ticked.
### Minion-status donut
A donut chart breaking down all known minions by their status: **online**, **offline**, **pending**, **rejected**, or **denied**. Data comes from the same minion snapshot table used by the [Minions](./minions) page.
### Key-status bar chart
A bar chart grouping all keys by their approval state (accepted, pending, rejected, denied). This gives you an inventory-level view of fleet onboarding health. The data is served live from the Salt master via the same `/api/keys` endpoint used by the [Keys](./keys) page.
## Recent activity
When the [event stream](/features/settings#event-stream) is enabled, the Overview includes a **Recent activity** widget — a compact, live-updating list of the latest fleet events (jobs, keys, minions) that links through to the full [Activity](/features/activity) page.
At the top of the widget, a **heartbeat** indicator with a pulsing dot shows how many events arrived in a recent window (for example, *"12 events · last 60 min"*). It is a quick pulse-check that the fleet — and the event stream — is alive.
An admin tunes the widget from [Settings → Activity widget](/features/settings#activity-widget): which categories it shows, whether to hide dispatches or routine successes, how many events to list, and the heartbeat window. Those display settings are read by every user via `GET /api/activity/widget-config`; the underlying events are still filtered to the categories your role can view.
## Fleet heatmap and compliance sparkline
Above the KPI row, the **fleet heatmap** shows every minion as a tile, colour-coded by online/offline status; clicking a tile opens a side panel where you can run a command directly against that minion. Below it, the **compliance sparkline** and **top-failures chart** surface recent highstate trends.
## Navigation tiles
At the bottom of the page, a grid of section tiles links to every major feature. Tiles your role cannot access are hidden automatically — you only see what you have permission to use.
## Permissions
The Overview page assembles data from multiple endpoints. Each section is gated by the permission of its underlying endpoint:
| Section | Permission required |
| ------------------------- | ------------------- |
| Minion KPI / donut | `view:minion:*` |
| Keys KPI / bar chart | `view:key:*` |
| Running jobs / area chart | `view:job:*` |
Any authenticated session can load the page shell; the tiles and charts that you lack permissions for render a graceful empty state rather than an error.